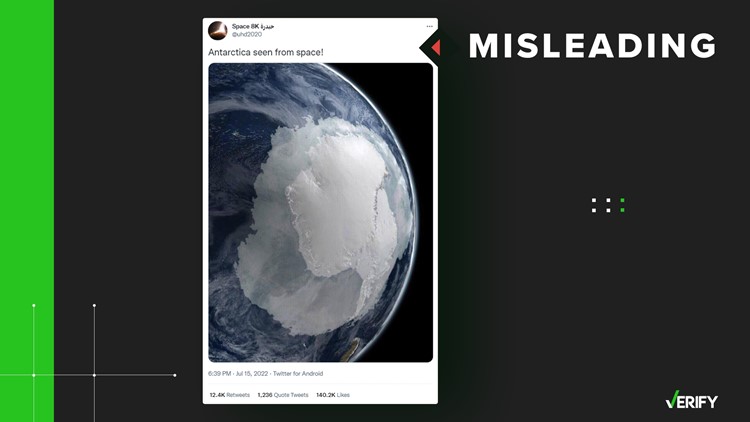
A Twitter account dedicated to astrophotography shared an image it said was Antarctica as seen from space. The image, which appears to depict a massive ring of sea ice around the continent, has been liked 140,000 times since it was first posted July 15.
One of the most popular replies to the photo was from a person who believed the photo was evidence that global warming is a hoax.
“Don't see any melting polar cap there, plenty of ice,” said the person in the reply. “Global warming? No.”
THE QUESTION
Is this a real photo of Antarctica as seen from space?
THE SOURCES
THE ANSWER
No, this is not a real photo of Antarctica as seen from space. It’s an image a NASA scientist created using real satellite data to depict what the continent would look during the time of year when it’s too dark for any satellites to photograph it.
WHAT WE FOUND
The image in the tweet, which is not a real photo, is a visualization by NASA’s Cindy Starr released in 2007. The visualization was designed to depict the extent of the sea ice in the Antarctic on Sept. 21, 2005.
Sea ice is frozen ocean water that forms, grows and melts entirely within the ocean. In contrast, glaciers and icebergs form on land. In the visualization that went viral, the sea ice is the area of light blue between the dark blue of the unfrozen ocean and the white of the continent.
Starr created the image using a combination of real data and photos from NASA satellites. For the sea ice, Starr pulled from data collected by NASA’s AQUA satellite, which measures Earth’s microwave radiation to determine how much sea ice surrounds Antarctica. Microwave radiation readings from land, sea ice and open ocean are all different, so scientists can use the readings to identify sea ice and measure it.
She then combined that microwave radiation data with infrared radiation readings from both NASA’s AQUA satellite and its TERRA satellite. This kind of radiation creates infrared light, which is invisible to the human eye but can be picked up by equipment like satellites. Starr used infrared readings from September 2004 to create the Antarctic continent, and used readings from 2002 to add in the cloud cover.
Why would NASA have to use all of this data to create this image, instead of just using satellite photos? It’s because Antarctica is in constant darkness during its winter, which occurs during the same months that make up American summertime. Since much of Antarctica would be shrouded by darkness during the winter, NASA says it can only photograph the continent during the summer.
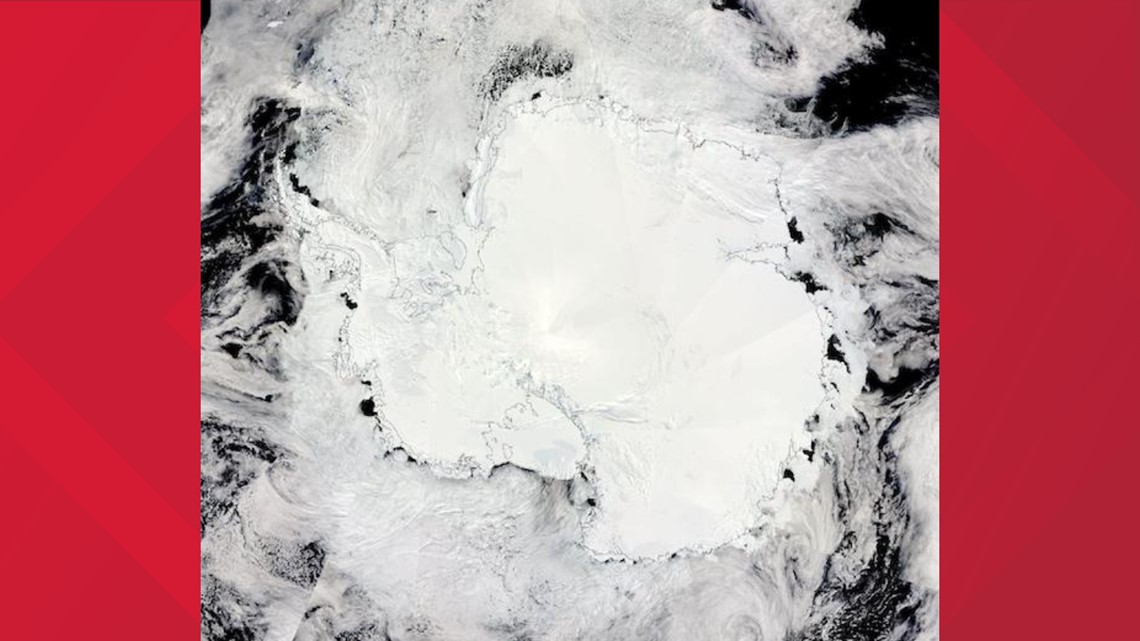
Actual NASA photos of Antarctica are always taken during the continent’s spring or summer. Antarctic sea ice appears white in these photos, almost identical to the color of the continent itself, rather than light blue like it appears in the visualization. There is very little sea ice in these photos, a stark contrast to the sea ice extent depicted in the visualization.


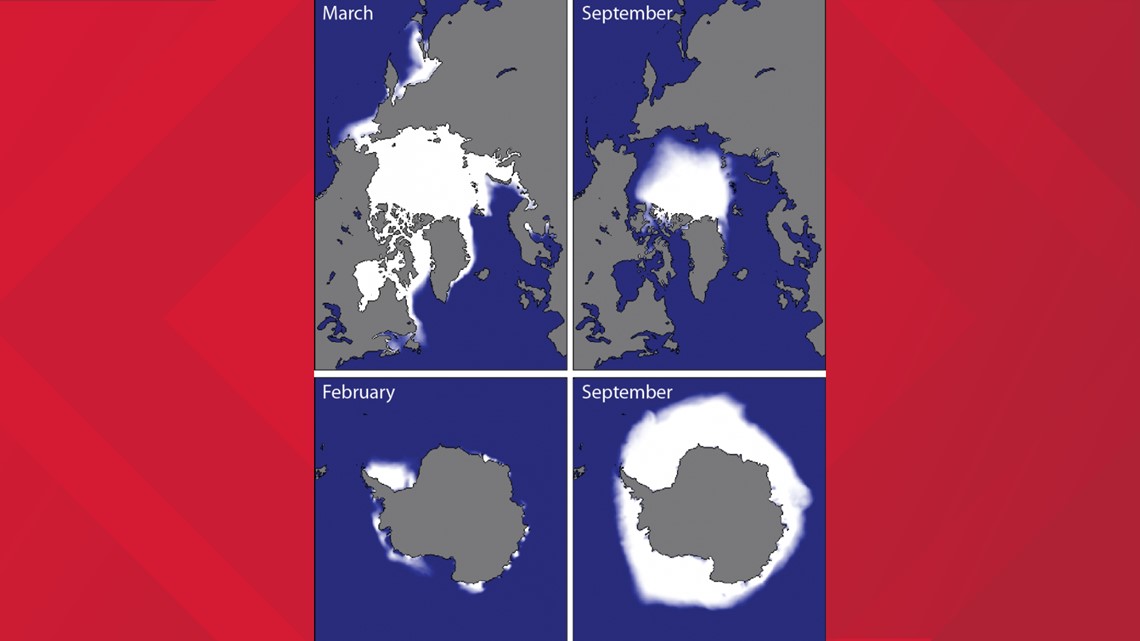
Antarctica’s sea ice varies greatly between seasons, which is important for understanding why the sea ice looks like it covers a much larger area than we’d normally see in a photo of Antarctica.
An image created by the National Snow and Ice Data Center (NSIDC) depicts the average minimum and maximum sea ice during March and September for the Arctic and Antarctic from 1981 through 2010. It shows that during September, which is winter for Antarctica, sea ice typically surrounds the continent in much the same way the NASA visualization depicts. But in February, a summer month for Antarctica, almost all of the sea ice surrounding the continent melts away.


“At its winter maximum, Antarctic sea ice covers an area of around 11 million square miles: almost twice the size of the United States of America, and larger than Antarctica itself,” the Antarctic and Southern Ocean Coalition says.
Not only does Antarctic sea ice vary wildly between seasons, but it also does so on an annual basis, too.
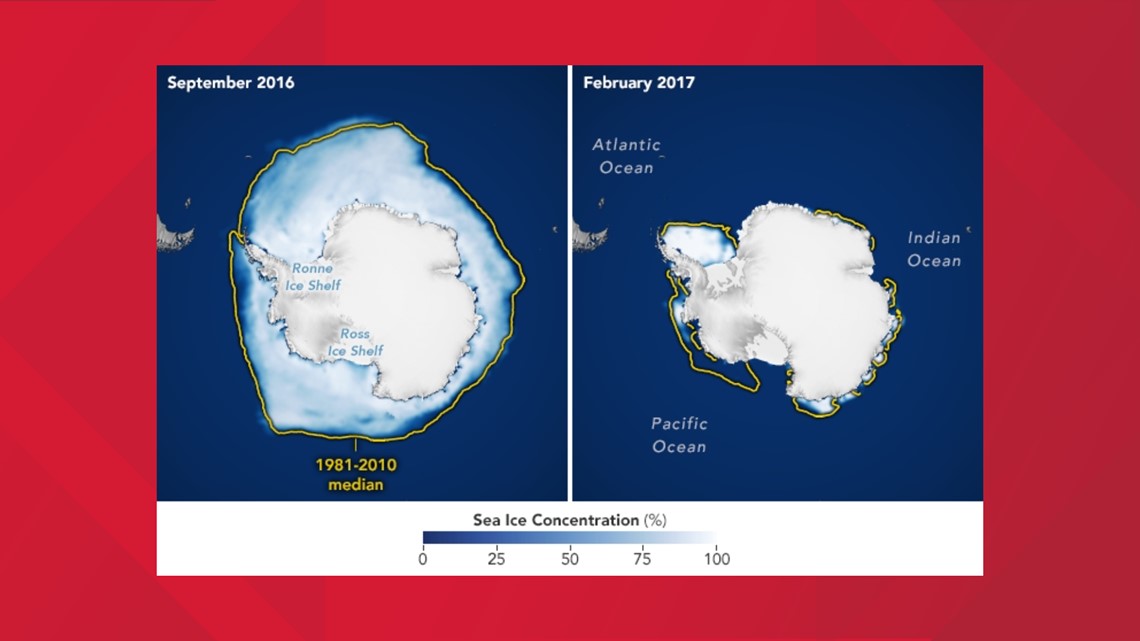
Since measurements began in 1978, Antarctica’s sea ice cover gradually increased for about 30 years. In 2014, Antarctic sea ice cover hit a record high, according to the Antarctic and Southern Ocean Coalition. In 2017, just three years later, it hit a record low.
“Within only three years, 35 years of gradual gains had been lost,” the Antarctic and Southern Ocean Coalition said.


Researchers are currently studying Antarctica’s changing sea ice to improve the performance of climate models and better predict the changes to come. The Antarctic and Southern Ocean Coalition say warming oceans, local winds, cloud cover, meltwater from ice shelves, the ozone hole and variable climate patterns such as the El Niño affect Antarctic sea ice dynamics. It’s currently unknown whether the properties of the ice, such as its thickness, is changing due to global warming
NASA offers a timeline of September and February Antarctic sea ice cover from year-to-year, and how that year’s ice compares to the median between 1981 and 2010. Sea ice cover in September 2005, the same month the visualization from the tweet depicts, was around the winter peak’s median, if slightly less.
More from VERIFY: No, the Supreme Court did not overturn the Clean Water Act


